For founders, marketers and brand owners running Meta ads
The Meta ads analyst that already knows your account
The Peach System loads up to 12 months of your Meta ads history when you sign up, adds your Shopify sales from the day you connect and sends you the changes to make each week, from budget to creative. Nothing to export or upload.
Black Friday is in 6 weeks.
Black Friday went well for you last year. That week returned $5.20 for every $1, and the two weeks before it were nearly as strong at $4.80 while cost per 1,000 views was 18% lower. We'd suggest having your Black Friday ads live from 13 November this year, so more of your budget runs while costs are lower.
- Raise the budget gradually from 13 November, before costs rise.Based on last year's Black Friday weeks
- Brief video and bestseller ads now so they are ready to launch.Last year's sale ads did best with people who had already seen the brand
- We'll watch cost per 1,000 views each week and let you know if it starts rising early.Compared with the same weeks last year


A store using The Peach System, April to September 2026
Compared with the same months in 2025. Revenue from Meta ads grew more than twice as fast as ad spend.
17 April to 30 September in each year. Revenue is the revenue Meta attributes to the ads. The account is managed by The Digital Peach team using The Peach System. The store's name is withheld.
The reporting dashboard for a sample store. Meta and Shopify data, updated daily.
What it takes to get this from an AI chat each week
Claude and ChatGPT can now connect to your Meta ad account. To get a weekly analysis from them, this is the work involved.
An AI chat connected to Meta
- 1Connect Meta and Shopify, then set up how orders are matched to campaigns
- 2Write the analysis prompt and ask again every week
- 3Tell it your seasons and how holiday dates move each year
- 4Check each figure it gives you
- 5Keep your own record of what it said and what changed
The Peach System
- Shopify orders matched to campaigns from the day you connect
- A new analysis every Tuesday
- Seasons matched to their dates each year
- Figures calculated from your Meta and Shopify data
- Every week saved to your account history
Your data is worked through in five layers before the analysis is written
Every figure in your weekly analysis is calculated from your own records first. The writing comes last and describes what the numbers show, with the changes to make.
Written from these figures, with the changes to make.
A full analysis of each week's performance, with the changes to make.
- Starts with the biggest change in your account that week
- Suggestions based on your own results, from budget to creative
- Each item followed up the next week until it is resolved
Meta and Shopify data in one dashboard, updated daily.
- Ad spend and Shopify revenue shown together
- Choose any date range and export the report
- Up to 12 months of Meta history loaded when you sign up
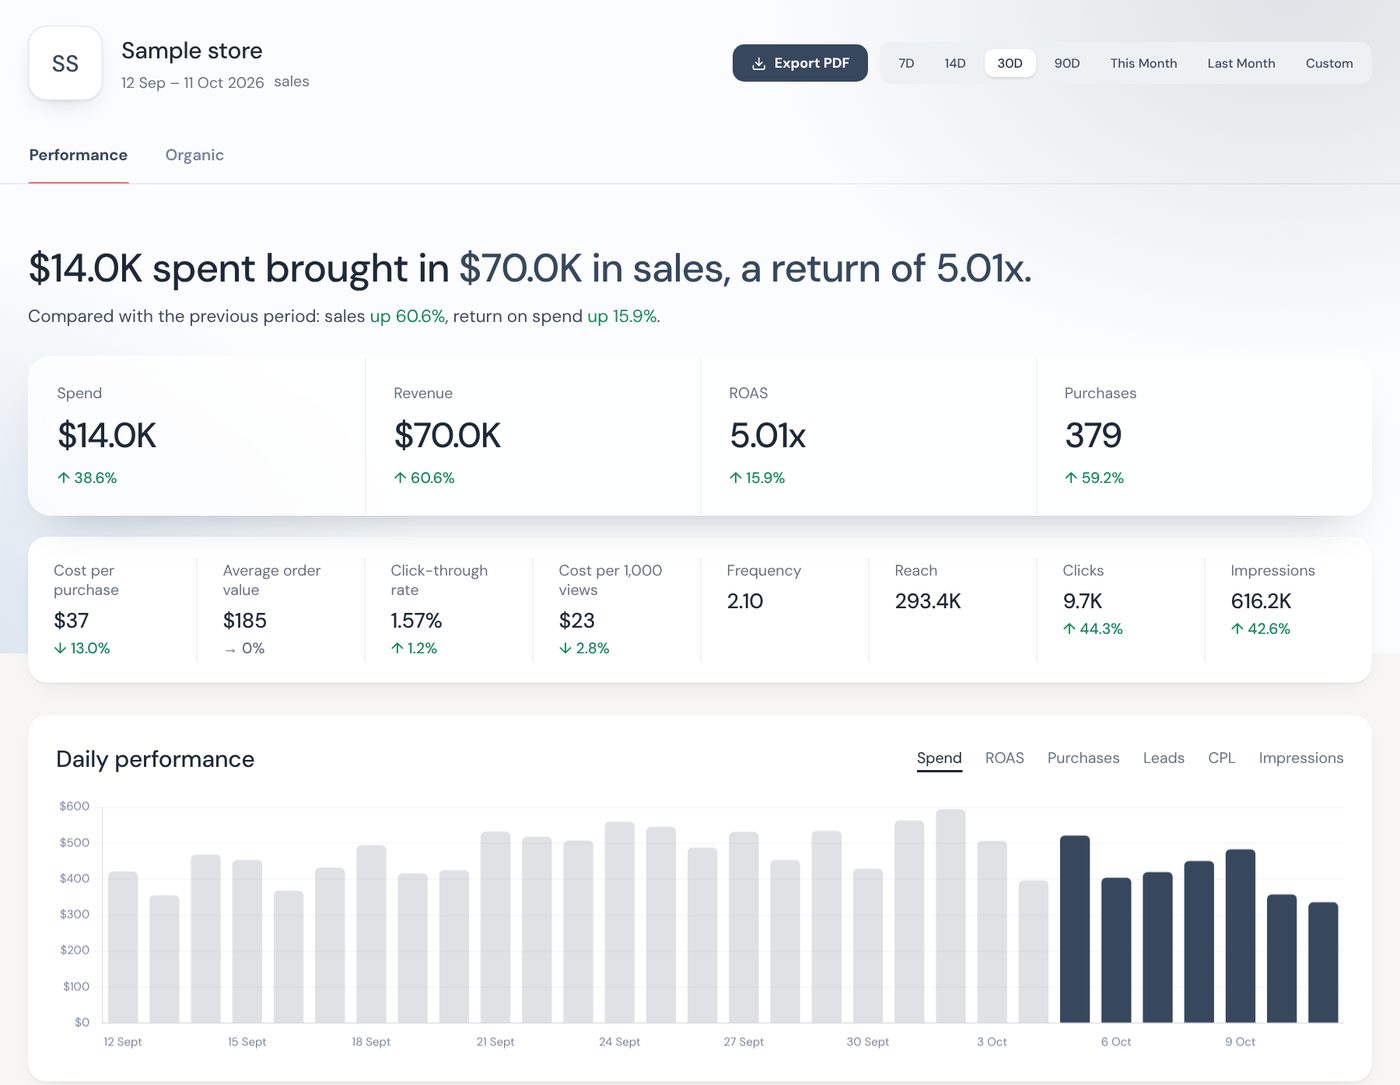
Return on ad spend calculated from Shopify revenue.
- Shopify orders matched to your Meta campaigns
- The campaigns and ads that produced sales, shown alongside the conversions Meta reports
- Return on spend based on the revenue recorded in your store
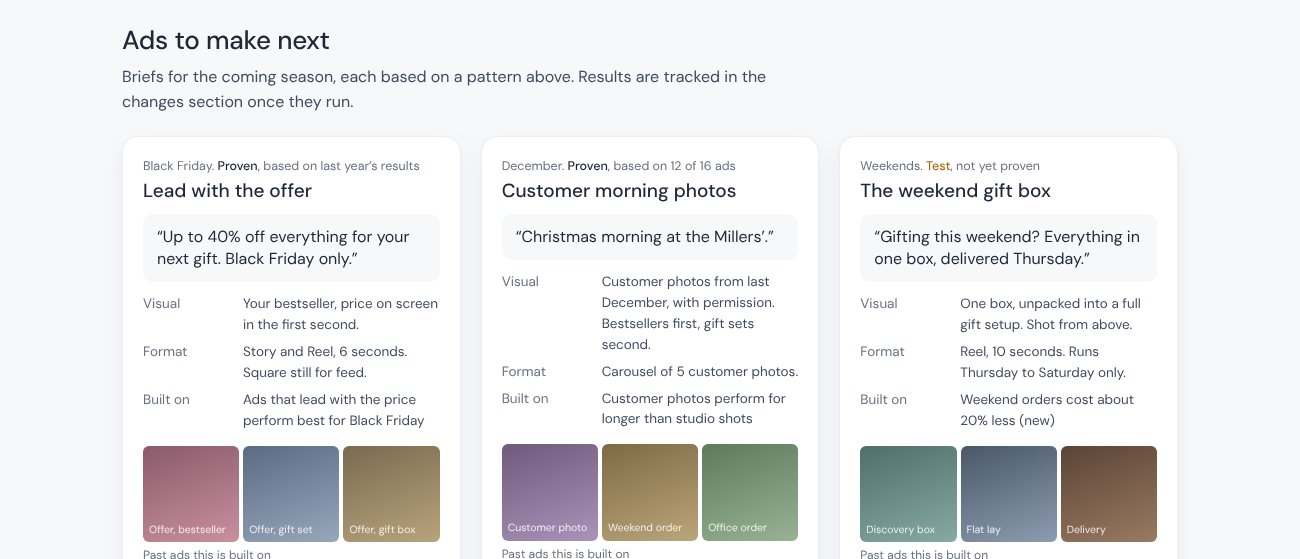
Briefs for new ads, based on your results.
- Based on the hooks, formats and opening lines that performed best in your account
- Each brief lists the past ads it is based on
- Ready to send to your designer
Seasonal planning based on your own sales
The Peach System shows when your sales peaked and dropped last year, and the weeks where more budget paid off. It accounts for fixed dates such as Black Friday and Christmas, and for holidays that move each year, such as Easter, Ramadan and Eid.
Your own seasonal patterns
Peaks and quieter periods are taken from your account history.
Preparation dates
Each season shows when to start preparing budgets and campaigns.
Year-on-year comparison
Each season is compared with the same season last year.
The light bar shows the preparation period. The dark mark shows when sales peaked for this account.
Built by a Meta Business Partner agency
The Digital Peach built The Peach System to run its own client accounts. It is now available to any business running Meta ads, with the same weekly analysis the team uses.
We recommend the changes. You make them.
Each analysis sets out what to change and why. You decide what happens in your account.
- Every recommendation shows the figures it is based on
- You make each change yourself in Ads Manager
- Each week is added to your history and used in the next comparison
How your 7-day free trial works
Something new arrives in your account during the trial, starting within hours of signing up.
Your first analysis
Up to 12 months of your Meta history loads, and your first analysis is ready within hours.
- Three things from your last 12 months, in your own numbers
- Your next season, with when to start preparing
- What to change first
Your progress check
A follow-up on what your first analysis flagged.
- What has moved since
- What to do next
Your full history
You can see everything included before you pay, with figures from your own account.
- History extended up to 3 years
- Every season in the year ahead
- A new analysis every Tuesday, with each item followed up
Start with a 7-day free trial
Your first analysis is ready within hours of signing up.